I got a question how to find what was wrong when you only got an error “Exception has been thrown by the target of an invocation. [The server committed a protocol violation The server response was: …]” from a junior developer and I want to share my answer with all of you since it can be a little tricky.
The Exception “thrown by the target of invocation” indicated that an error has occurred in code called by using invoke through dot net reflection. This technique is common when you have plug-ins (like scheduled jobs in EPiServer) and other late binding in run-time.
The text in square brackets are the original exception (caught by the Invoke() method) and gives a clue what goes wrong but it is usually not enough to find the error.
How to find more clues when debugging
As always when searching for the cause of a problem or error condition the first rule is to get more clues. Usually this process consist of finding a reproducible test scenario that triggers the condition and hook up the debugger to see what is happening inside the application.
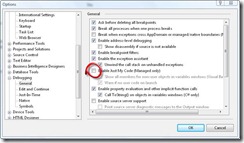
We must make sure it halts on thrown exceptions even if it outside our code to get a call stack that can help us. Open your options dialog and uncheck ”Enable Just My Code”.
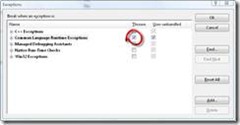
With default settings the debugger will only break on uncaught exceptions. We need the debugger to break when an exceptions are thrown regardless of they are handled by a try-catch statement.
This can be changed in your Exceptions dialog (Ctrl+Alt+E). You can either set it to catch all managed exceptions as I have in the screen shot below or if you know what exception you are looking for you can halt on that one alone to minimize noise since it will probably halt on exceptions a lot of places that are normal before reaching your area of intrest.
With this setup we are now ready to run the test case again to trigger the error. If everything is correctly configured it will break on the exception and show you a call stack.
Use the debugger windows in Visual Studio to examine the Call Stack. Inspect parameters and Local Variables at each step in the call stack. This should give enough clues so to find what is causing the error.
How to find more clues when you do not have the source code
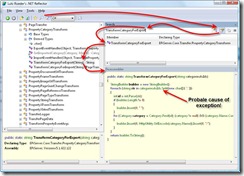
If the exception is raised in code that is not our own we can use several strategies to find out more. One of the best is to use Lutz Roeder’s .NET Reflector and click File>Open to load all assemblies in your web applications bin-folder. Search for the class or method and Disassemble the methods outside your code and get more clues. (Another way, if the exception is inside Microsoft code, is to configure VS to use Microsoft source server to download source code.)
Here is an example of when I caught a “Exception has been thrown by the target of an invocation. [NullReferenceException: Object reference not set to an instance of an object.]“ and found TransformCategoryForExport in the call stack.
By analyzing the call stack we can usually also find the point in our own code that is starting the chain of calls causing the exception. I would recommend setting a break point there and rerunning the test case to see if the parameters to the call are invalid.
Need more help?
God luck with you bug hunting! If you are stuck you are welcome to contact me at INEXOR and buy my services.


